Tracing Travel Fatigue Patterns That Quietly Reshape Value Lines in European Soccer and ATP Tennis Circuits
Klara Simmons · May 20, 2026
Tracing Travel Fatigue Patterns That Quietly Reshape Value Lines in European Soccer and ATP Tennis Circuits
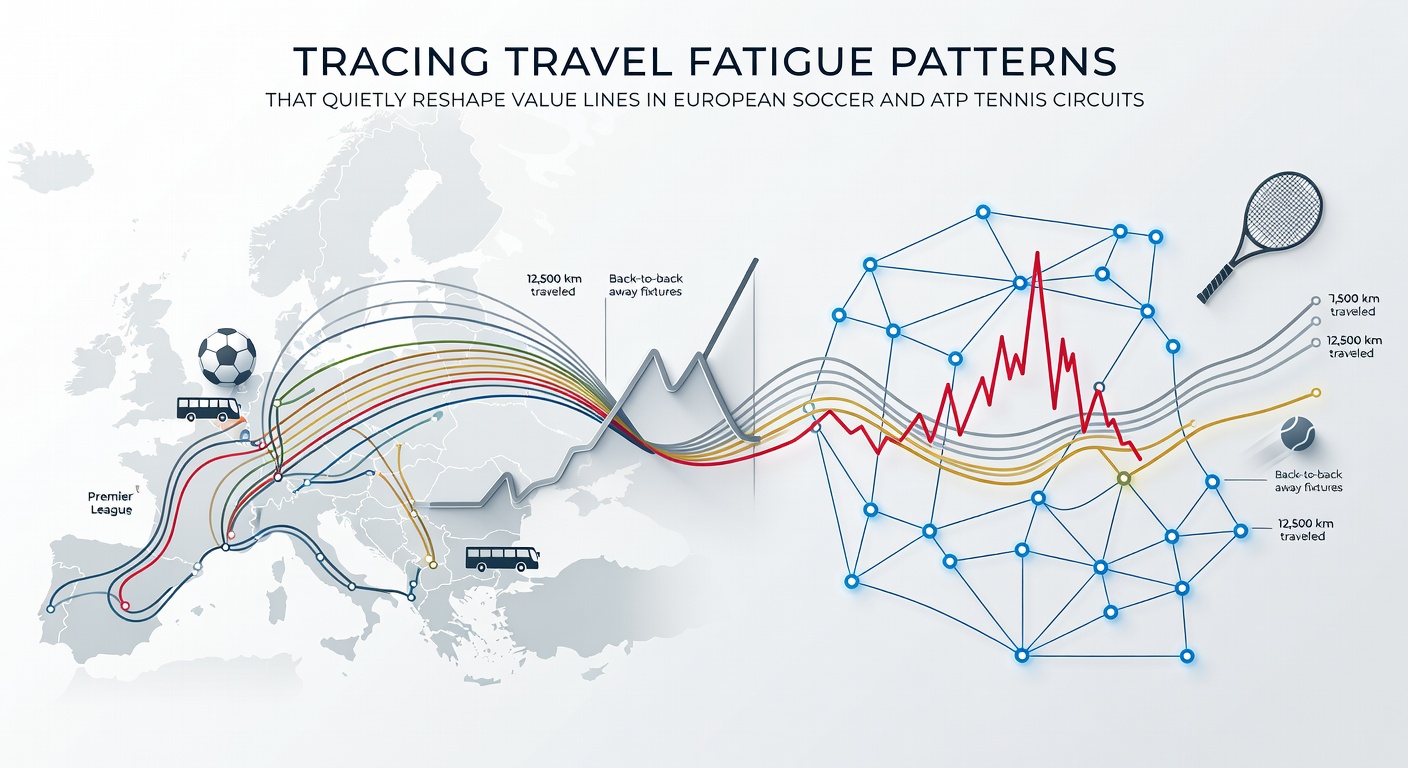
Travel fatigue has emerged as a measurable factor that quietly influences performance metrics across European soccer leagues and the ATP tennis circuit, with data sets from multiple seasons showing consistent dips in key indicators after long-haul trips. Observers note that these patterns affect recovery windows, sleep cycles, and reaction times, which in turn feed into betting markets where value lines adjust based on historical performance gaps rather than headline form alone. Researchers tracking fixture lists in May 2026 have documented how congested calendars amplify the issue, especially when teams or players cross multiple time zones within short periods.
Understanding Travel Fatigue in Competitive Schedules
European soccer clubs competing in domestic leagues and continental tournaments often face back-to-back fixtures that require rapid movement between cities, whereas ATP players navigate a global tour with frequent flights between continents. Studies compiled by sports science groups reveal that journeys exceeding four hours correlate with reduced high-intensity running distances in soccer and lower first-serve percentages in tennis during the initial matches following arrival. The reality is that circadian rhythm disruptions play a central role, since players must adapt to new time zones while maintaining training loads that leave little margin for adjustment.
Data from the 2025-2026 campaign indicates that teams traveling eastward experience sharper declines in the first 48 hours compared to westward movements, a distinction tracked through GPS metrics and heart-rate variability readings. Those who've analyzed ATP rankings shifts point out similar trends during the European swing, where players arriving from Australia or the Americas show measurable drops in win rates during the opening rounds of clay-court events. This pattern holds across surfaces and formats, creating opportunities for lines to reflect the underlying recovery timelines rather than surface familiarity alone.
Patterns Observed in European Soccer During May 2026
With the season winding down in May 2026, fixture congestion intensifies across the Premier League, La Liga, and Bundesliga as clubs balance league positions with cup commitments and European finals preparation. Analysts reviewing match logs have identified clusters where away sides traveling more than 1,500 kilometers post a lower expected goals output in the opening 30 minutes, a trend that sharpens when kickoff occurs within 36 hours of landing. Betting markets respond by nudging totals and handicap lines accordingly, particularly in matches involving clubs from northern Europe heading south for midweek fixtures.
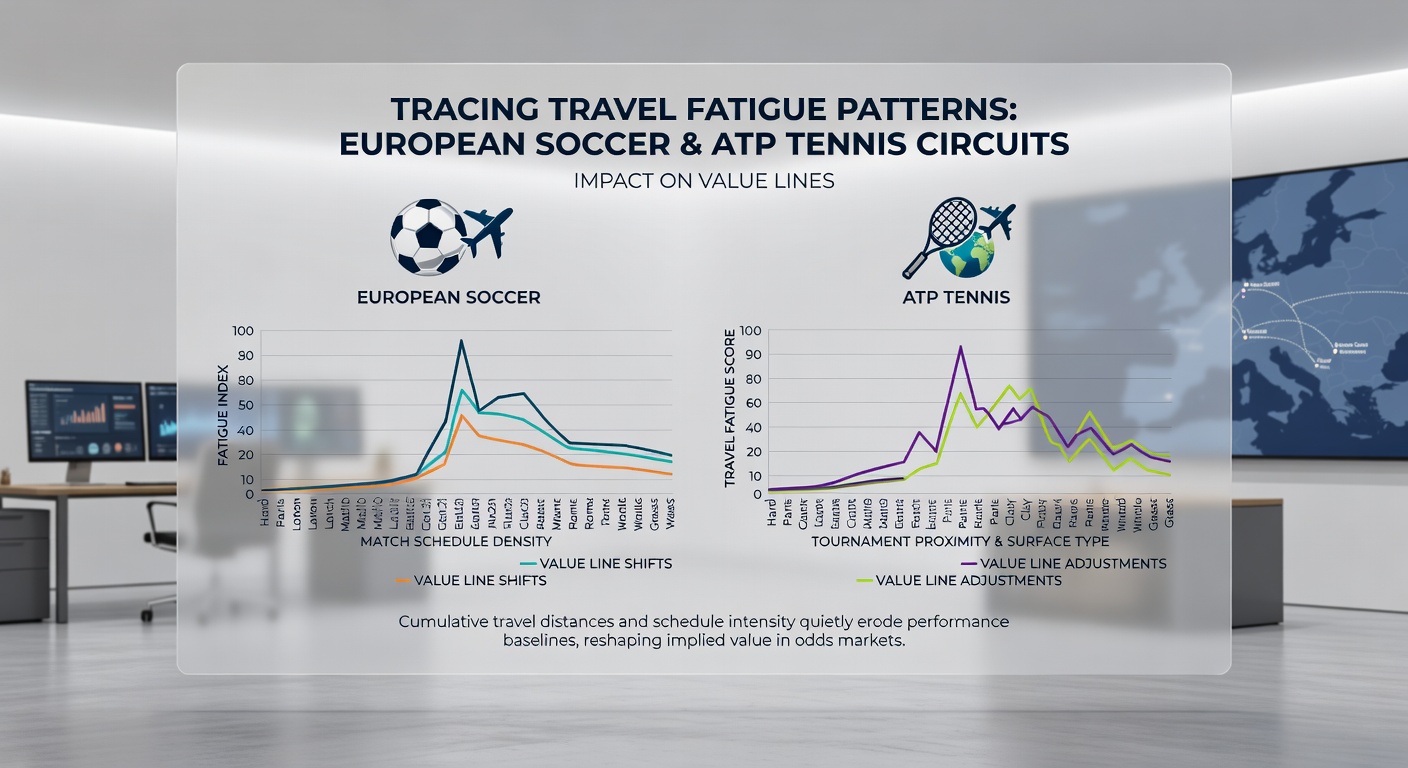
One dataset compiled by a German sports performance institute shows that squads covering multiple domestic and international trips in a single month record an average 12 percent reduction in sprint frequency compared to rested opponents. The ball's in the market's court when these statistics surface, since oddsmakers incorporate travel distance logs into their models well before public perception catches up. What's interesting is how this effect compounds during the final stretch, when motivation remains high yet physical reserves sit lower than early-season baselines.
ATP Tennis Circuits and Cross-Continent Fatigue
ATP players face a different set of variables, with the calendar demanding transitions from hard courts in North America to clay in Europe during spring months. Research indicates that athletes logging more than 25,000 kilometers in a three-month window display slower court coverage and extended rally durations in early tournament rounds. In May 2026, several top-ranked competitors arrived in Madrid and Rome after extended schedules that included South American and Asian stops, producing observable adjustments in point-construction patterns during best-of-three sets.
Those monitoring ranking points and head-to-head records note that underdogs with shorter recent travel itineraries often exceed implied probabilities in the opening sets, a factor that quietly shifts live betting volumes. A report from the Australian Institute of Sport highlights how recovery protocols, including targeted light exposure and nutrition timing, can mitigate some effects, yet implementation varies widely among players based on support staff resources. The writing's on the wall for markets that overlook these variables when constructing early-week odds.
How Fatigue Data Influences Value Lines
Value lines in both soccer and tennis respond to travel fatigue signals through incremental shifts rather than dramatic swings, since public perception tends to lag behind detailed performance tracking. Bookmakers integrate flight logs, time-zone differentials, and prior match density into proprietary algorithms that adjust totals and player props before widespread awareness develops. Observers following these adjustments report that soccer over/under lines on total corners or cards frequently move when fatigue models flag elevated error rates from the traveling side.
In tennis, similar patterns appear in game and set totals, where players with recent long-haul arrivals show reduced hold percentages on serve. The European Sports Science Consortium published findings in early 2026 that linked cumulative travel hours to a measurable rise in unforced errors across clay-court events, providing another data point that sharpens implied probabilities. Those integrating such inputs into accumulator construction gain edges by focusing on specific markets rather than broad match outcomes.
Conclusion
Travel fatigue continues to register as a subtle yet consistent variable across European soccer and ATP tennis, with May 2026 offering fresh examples of how fixture density and long-distance movement reshape performance baselines. Data sets from independent research bodies demonstrate that recovery timelines influence key statistics, which markets translate into adjusted value lines well ahead of public narratives. Continued monitoring of travel logs alongside traditional form indicators allows for clearer identification of mispriced opportunities in both circuits.