Roster Depth Charts Reveal Key Patterns for Refining Bets on Basketball and Football Substitutions
Amir Berger · Aug 21, 2026
Roster Depth Charts Reveal Key Patterns for Refining Bets on Basketball and Football Substitutions
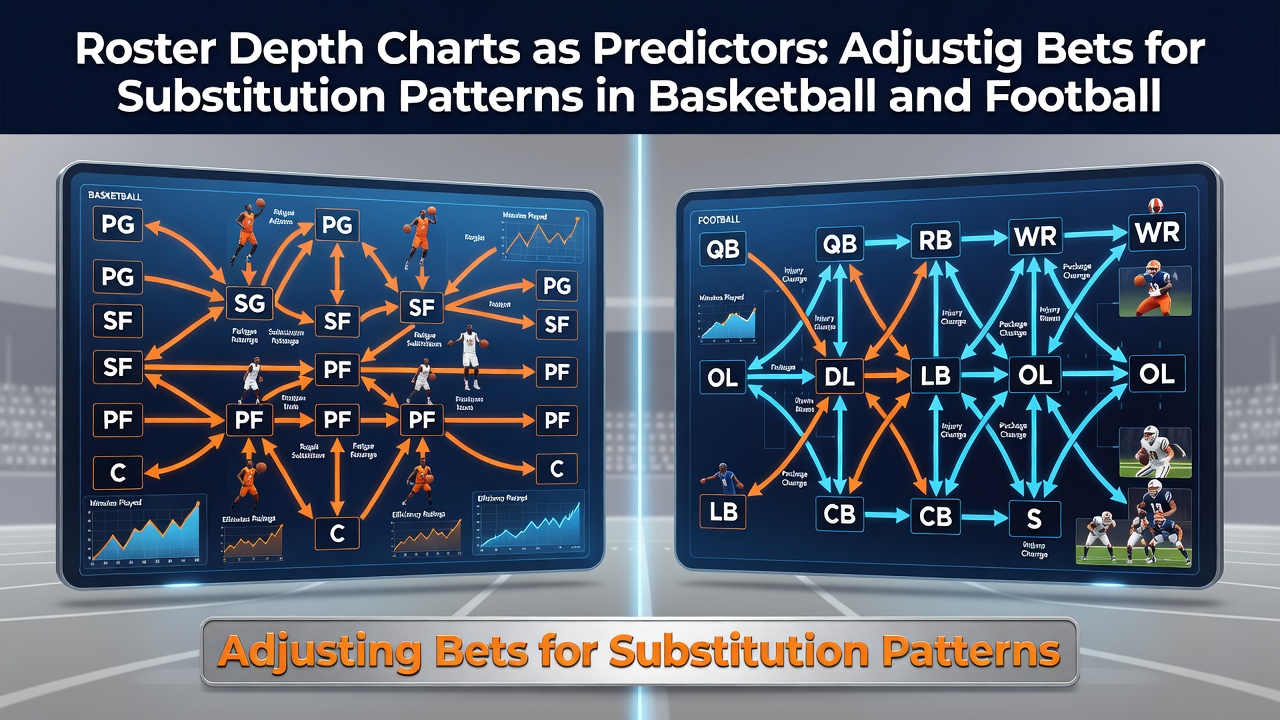
Depth charts serve as foundational tools that outline player rotations and potential substitutions across basketball and football rosters, allowing bettors to anticipate shifts in team performance during games. These charts list starters alongside reserves in order of expected playing time, and they update frequently based on injuries, coaching decisions, and performance trends. In August 2026, teams across both sports release preseason depth charts that often carry forward into regular season betting markets, where substitution patterns influence totals, spreads, and player props in measurable ways.
Substitution Patterns in Basketball and Their Betting Implications
Basketball features frequent substitutions due to the sport's high pace and foul accumulation rules, which means depth charts help identify when second-unit players enter and alter scoring efficiency or defensive matchups. Studies from sports analytics groups show that teams with strong bench depth maintain consistent point differentials even after starters exit, whereas shallow benches lead to drops in effective field goal percentage during rotation periods. Observers note that betting lines adjust when depth charts indicate heavy reliance on key reserves, especially in back-to-back games where fatigue compounds substitution effects.
Coaches deploy specific patterns, such as staggered rotations that keep one starter on the floor with reserves, and these decisions appear in real-time data feeds that bettors monitor. Data from professional leagues indicates that over/under totals move when depth charts highlight mismatches in bench scoring output compared to opponent reserves. One analysis of recent seasons found that squads with versatile sixth men posted higher adjusted efficiency ratings in the middle quarters, prompting line movements in live betting markets.
Football Roster Depth and Its Role in Game Script Adjustments
Football depth charts extend across offense, defense, and special teams, with substitutions occurring at positional groups rather than on every possession, which creates longer stretches where bench players impact run versus pass balance or coverage schemes. Researchers have tracked how offensive line depth affects sack rates and rushing yards when starters rotate out, while defensive depth influences third-down conversion rates in predictable ways. According to reports compiled by the NCAA, depth chart changes announced before conference play correlate with shifts in point spread margins, particularly in games involving teams with limited experienced backups at skill positions.
Coaching staffs adjust substitutions based on game script, such as inserting fresh defensive linemen in obvious passing situations, and these patterns factor into totals betting when depth charts reveal mismatches in stamina or technique. Figures from league tracking systems reveal that teams with superior interior depth sustain higher tackle rates in the second half, which influences live betting adjustments on under totals. Analysts cross-reference depth charts with injury reports to project how early substitutions might accelerate or slow the pace of play.
Integrating Depth Chart Data Into Betting Adjustments
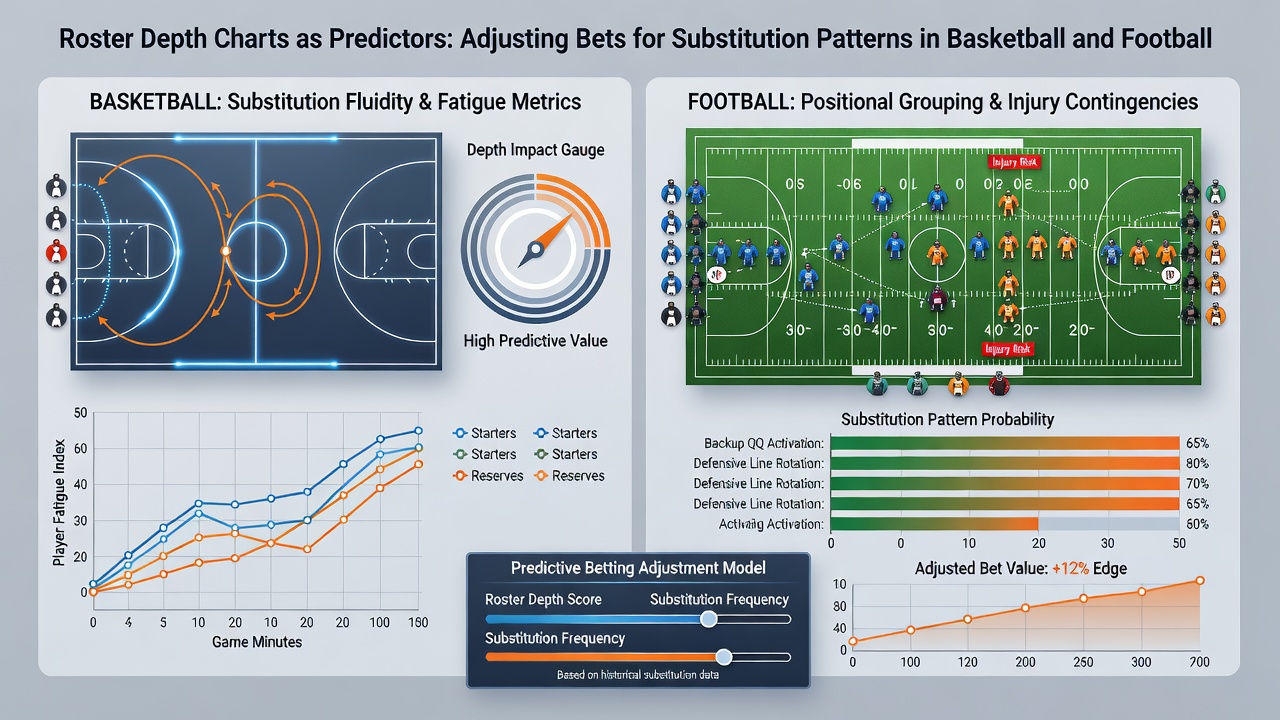
Bettors combine depth chart information with historical substitution data to refine wagers, focusing on metrics like bench plus-minus in basketball or snap count distributions in football. Multiple sources, including academic papers on sports performance modeling, demonstrate that incorporating rotation projections improves accuracy when forecasting second-half totals and player-specific props. For instance, when depth charts signal a heavy minute load for a basketball team's primary scorer, betting markets often see movement on individual player over points lines before tip-off.
Football markets respond similarly when depth charts expose vulnerabilities at backup quarterback or cornerback positions, leading to adjusted spreads as bettors anticipate increased passing volume or big-play opportunities. What's notable is how real-time updates to these charts, released through team channels, prompt immediate line reactions in major sportsbooks. Those who monitor preseason camp reports in August gain early insight into emerging substitution hierarchies that carry into the season.
Case Examples From Recent Seasons
Take one basketball program where depth chart shifts highlighted an emerging three-point specialist off the bench, and subsequent games showed elevated team three-point attempt rates during reserve stretches, which altered totals betting behavior. In football, a case involving a team with thin linebacker depth revealed higher explosive play rates allowed when starters rotated, prompting value on opponent overs in live markets. These examples illustrate how depth charts function as predictive layers rather than static lists.
Research published by university sports science departments further supports that teams publishing transparent depth charts experience more stable betting lines compared to those with frequent undisclosed changes. Data aggregation platforms compile these charts across conferences, enabling pattern recognition that refines both pregame and in-game wagers.
Conclusion
Depth charts continue to serve as reliable inputs for adjusting bets around substitution patterns in basketball and football, with data from multiple seasons confirming their influence on efficiency metrics and line movements. Bettors who integrate these charts with performance tracking gain structured approaches to markets that respond to rotation decisions throughout games. As leagues release updated charts in August 2026 and beyond, the connection between roster construction and betting adjustments remains a consistent factor in both sports.