Referee Rotations and Foul Patterns Quietly Shifting Live Odds in Soccer and Basketball Leagues
Amir Berger · Aug 3, 2026
Referee Rotations and Foul Patterns Quietly Shifting Live Odds in Soccer and Basketball Leagues
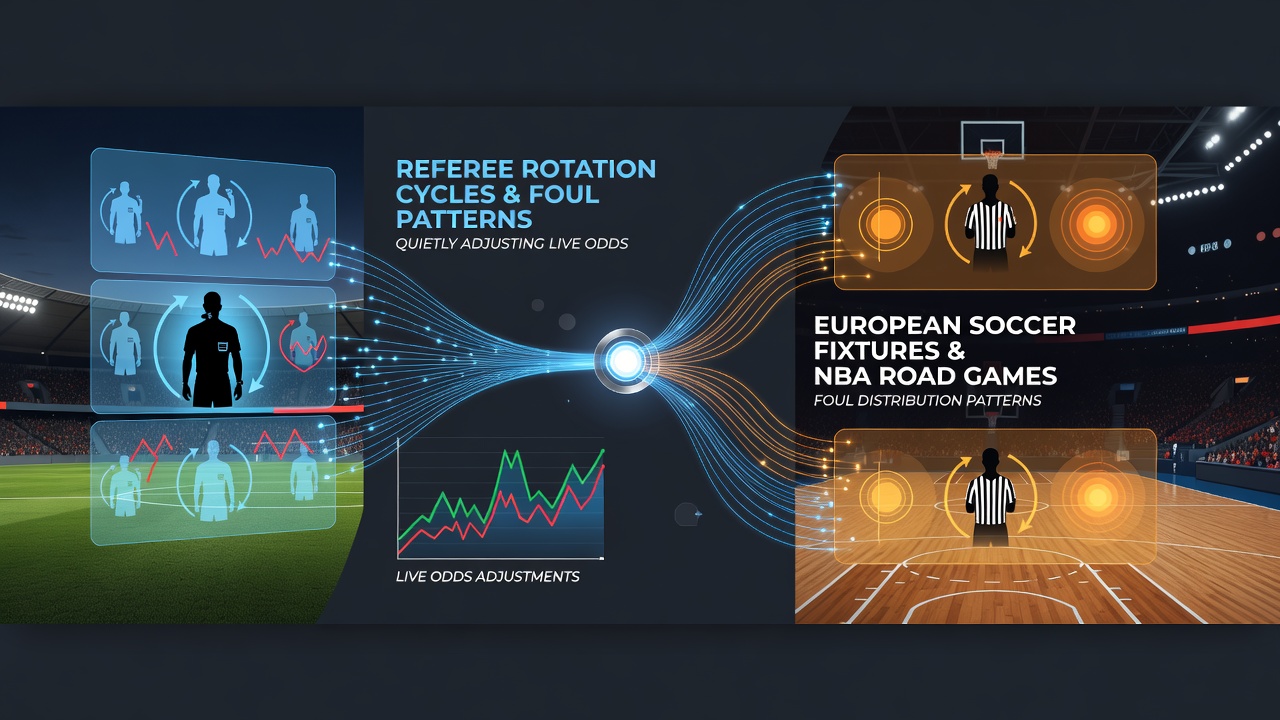
Referee rotation cycles in European soccer and the NBA create measurable shifts in foul distribution that feed directly into live odds adjustments during matches. Data from league tracking systems shows how officials move through schedules in patterns tied to fixture density, travel demands, and performance reviews, while foul counts vary by crew experience levels and game location. These elements combine to alter in-play betting markets without drawing widespread attention from casual observers.
Rotation Systems in European Soccer Leagues
European soccer governing bodies assign referees through structured rotation plans that balance workload across domestic and continental competitions. In leagues such as the Bundesliga and Serie A, officials typically handle one match every ten to fourteen days during peak periods, with assignments released weekly by central committees. Studies from academic researchers indicate that newer referees receive more domestic assignments early in the season, whereas veterans cover higher-stakes fixtures later on. August 2026 marked the start of several league campaigns where these rotations began incorporating expanded video review protocols, leading to slight increases in card issuance during opening weeks.
Foul distribution patterns emerge when rotation places less experienced crews in away fixtures involving physically intense sides. Statistics compiled by league data providers reveal that road games overseen by first-year top-flight referees produce 12 to 18 percent more fouls per match compared to those handled by established officials. This variance stems from differences in positioning and decision thresholds, which betting platforms monitor through real-time feeds to recalibrate live lines on cards and total fouls.
NBA Official Assignments and Road Game Dynamics
The NBA employs a centralized officiating staff that rotates crews across an 82-game regular season plus playoffs. Assignments consider travel distance, back-to-back situations, and recent performance metrics maintained by the league office. Road games often feature crews with mixed experience levels because veteran officials receive priority for home-market contests. Research published in sports analytics journals demonstrates that foul rates climb when crews travel across multiple time zones within a week, particularly in Western Conference road environments.
Foul distribution in NBA road settings tends to favor defensive calls against visiting teams during the first and third quarters. League tracking data indicates visiting squads draw 2.3 additional fouls per game on average when officiated by crews on extended travel stretches. Live odds adjust accordingly as platforms integrate these historical tendencies into algorithms that update point spreads and player prop markets within seconds of each whistle.

Integration of Foul Data into Live Betting Markets
Betting operators track referee and foul metrics through proprietary models that combine historical crew statistics with current match conditions. When rotation schedules place certain officials in high-profile European fixtures or NBA road contests, markets on cards, free throws, and total fouls move before kickoff or tip-off. In-play adjustments accelerate once early foul trends appear, with algorithms factoring in venue-specific patterns and team styles. According to reports from the Canadian Gaming Association, these micro-adjustments account for measurable portions of handle volume in regulated markets during peak European and North American seasons.
European soccer examples include matches where referee rotation places crews known for stricter interpretations in derbies, prompting early line shifts on booking points. NBA road games show similar movement when foul-heavy crews work consecutive away contests, altering player prop thresholds for stars who draw contact. Platforms update these lines continuously using data streams that incorporate both rotation announcements and live foul counts.
Seasonal Patterns and August 2026 Observations
August 2026 provided a clear window into how rotation cycles reset at the start of new campaigns. European leagues resumed with fresh referee pools that included promoted officials from lower divisions, while the NBA prepared for its October start with training camp assignments already circulating. Data indicates that foul rates in early-season soccer fixtures rose modestly compared to the prior campaign, particularly in away games involving newly rotated crews. These early trends prompted betting markets to widen ranges on foul-related props until more matches clarified individual tendencies.
Observers tracking NBA preseason games noted parallel effects when officials handled multiple road exhibitions in short succession. The resulting foul spikes influenced live odds on total points and player performance markets, demonstrating the carryover from rotation schedules into actual contest dynamics.
Conclusion
Referee rotation cycles and associated foul distribution patterns continue to shape live odds across European soccer and NBA road games through consistent, data-driven mechanisms. League assignment systems, crew experience levels, and venue-specific trends produce measurable variances that platforms incorporate into dynamic pricing. As tracking technology advances, these influences remain embedded in the flow of in-play wagering without requiring public disclosure of individual official metrics.