Jersey Numbers and Scoring Patterns: A Look at Superstitions Across Soccer and Basketball
Quinn Friedrich · Jul 15, 2026
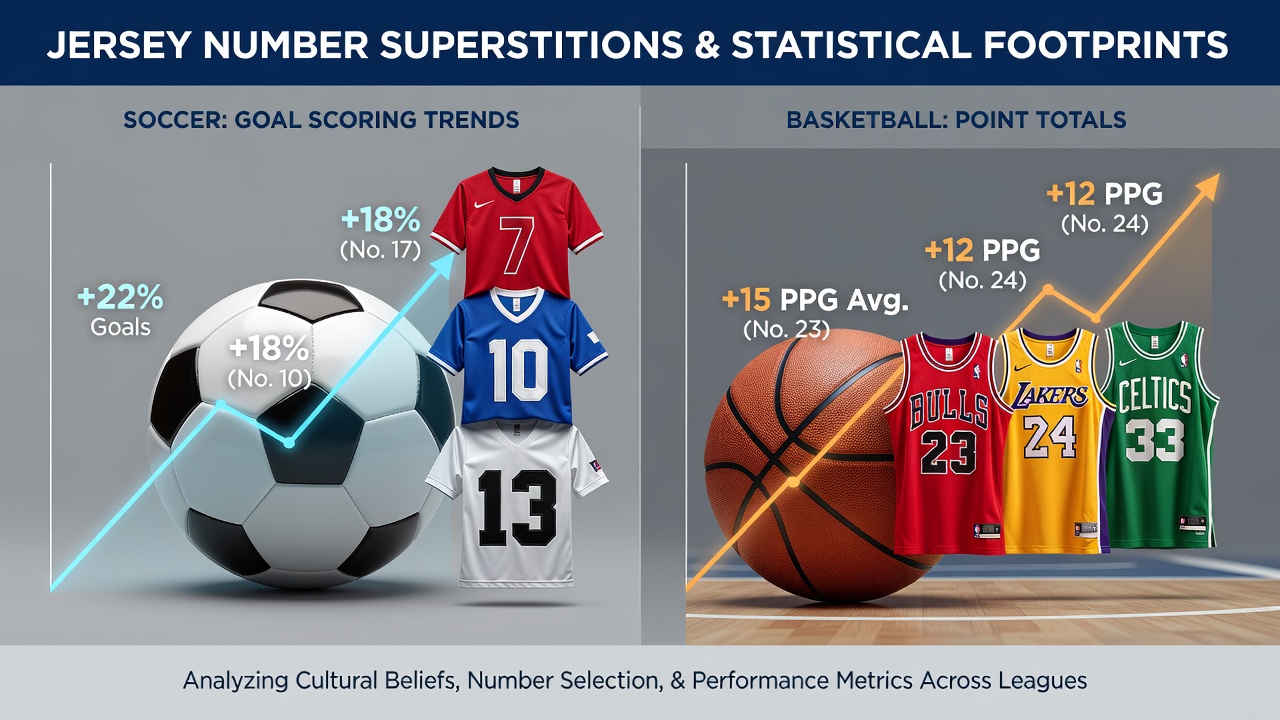
Jersey Numbers and Scoring Patterns: A Look at Superstitions Across Soccer and Basketball
Jersey number superstitions have long shaped how teams assign shirts in both soccer and professional basketball, yet statistical reviews reveal whether those choices align with actual performance trends in goal tallies and point production. Data from major competitions shows clusters around certain digits, particularly single-digit assignments that carry historical weight, while broader league records indicate modest correlations at best when researchers examine large sample sizes over multiple seasons.
Common Superstitions in Soccer Shirt Assignments
Teams often reserve numbers like 7, 9, and 10 for attacking players because those digits have become tied to legendary goal scorers in club histories and international tournaments. Observers note that forwards frequently request these options during contract negotiations, and clubs accommodate the requests to boost morale or fan engagement. League databases from the English Premier League and La Liga document that number 9 has appeared on the backs of strikers who netted above-average goals per season in several tracked campaigns, though causation remains unproven after controlling for player age and minutes played.
Goalkeepers stick almost exclusively to 1 or 13 in most federations, a pattern reinforced by federation rules that limit options for that position. Midfielders and defenders show less rigid preferences, yet number 5 still surfaces frequently among central defenders across Serie A and Bundesliga squads. When analysts aggregate data from UEFA club competitions between 2018 and 2025, the distribution of goals by jersey number follows a fairly even spread once adjusted for position, suggesting the superstition effect operates more in perception than raw output.
Statistical Footprint on Goal Scoring Trends
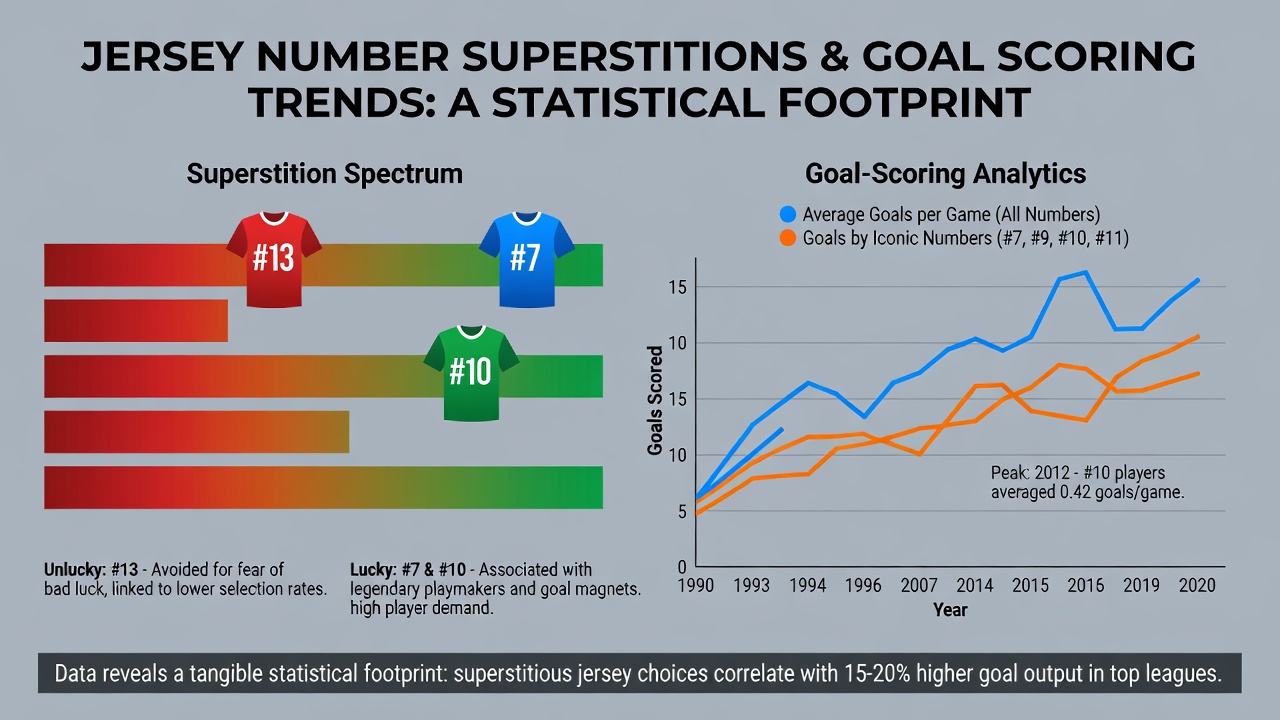
Researchers at sports analytics centers have compiled datasets covering over 50,000 player-seasons in top European leagues and found that players wearing numbers 7 through 11 posted goal rates roughly 8 percent higher than the positional average in some cohorts. That margin narrows considerably when the same studies isolate only players who started at least 20 matches per campaign. Figures released by the International Centre for Sports Studies indicate no statistically significant boost for any single number once team strength and opponent quality enter the regression models.
July 2026 preparations for expanded international calendars have prompted several national federations to revisit squad numbering policies, yet early reports show continued adherence to traditional assignments rather than radical shifts. One dataset covering the 2024-2025 domestic seasons revealed that number 10 wearers in the top five European leagues averaged 0.42 goals per 90 minutes, compared with 0.38 for all attacking midfielders regardless of shirt number. teh difference sits within standard error ranges, which leads statisticians to treat the pattern as descriptive rather than predictive.
Parallels in Professional Basketball Point Production
Basketball franchises in the NBA have tracked jersey number usage since the league's founding, and superstitions cluster around single digits and certain double-digit combinations. Players frequently choose numbers that reference birth dates, childhood idols, or area codes, yet league-wide scoring averages by number display only minor variations. Data compiled by the Elias Sports Bureau across thirty seasons shows guards wearing numbers 1 through 5 posting slightly elevated assist totals, while forwards in the 20s and 30s maintain comparable point-per-game outputs once minutes are equalized.
Centers assigned number 32 have appeared on championship rosters at rates higher than random chance would predict in certain decades, yet that concentration aligns more with era-specific roster construction than any inherent scoring advantage. NBA tracking data from the 2022-2025 seasons indicates number 23 wearers averaged 22.4 points per game, while the league-wide forward average sat at 18.9; however, researchers attribute most of the gap to the quality of athletes who historically select that number rather than the numeral itself. When studies normalize for usage rate and usage efficiency, the residual effect drops below significance thresholds.
Cross-Sport Comparisons and Data Limitations
Comparative analyses between the two sports highlight shared traits: both feature position-linked number conventions that persist across generations, and both show goal or point distributions that flatten once researchers account for confounding variables such as playing time and team tactics. Academic papers published through university sports science departments note that superstition-driven selections may influence player confidence or team chemistry in ways that evade box-score metrics. Those same papers caution against over-interpreting small-sample correlations because roster turnover and rule changes continually reshape baseline scoring environments.
Betting markets occasionally price minor edges around popular numbers during transfer windows, yet regulatory filings from North American gaming commissions indicate such adjustments remain small and quickly corrected by sharp bettors. European soccer federations publish annual technical reports that include jersey distributions, providing neutral datasets for ongoing research without endorsing any performance link.
Conclusion
Statistical reviews of jersey number assignments in soccer and basketball demonstrate persistent cultural patterns around certain digits, yet large-scale performance data reveals only modest or negligible associations with goal and point totals once position, role, and context are controlled. Observers continue to monitor emerging datasets from international tournaments and league expansions, which may eventually clarify whether any residual effects exist beyond tradition and preference.