Fatigue Shadows: Back-to-Backs and Fixture Congestion Reshape NBA and Soccer Betting Lines
Klara Simmons · Apr 24, 2026
Fatigue Shadows: Back-to-Backs and Fixture Congestion Reshape NBA and Soccer Betting Lines
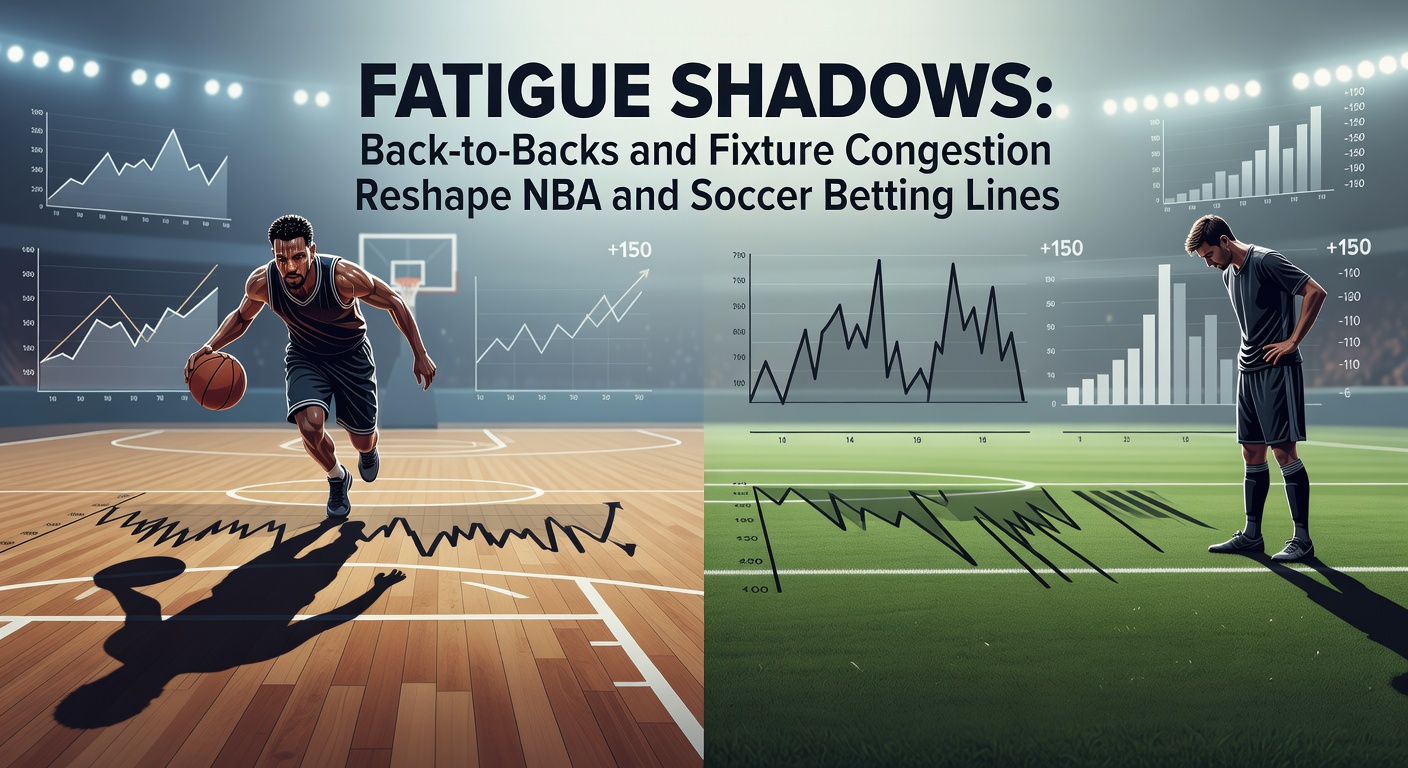
Teams grinding through back-to-back games in the NBA or navigating fixture pileups in soccer often see their performance dip, and sportsbooks respond by tweaking betting lines in real time, a pattern that's especially evident as April 2026 playoffs loom with schedules tightening across both leagues. Data from recent seasons reveals how rest—or the lack of it—directly influences point spreads, over/under totals, and moneyline odds, since fatigued squads shoot worse, defend sloppier, and commit more turnovers, forcing oddsmakers to bake those risks into their models while sharp bettors hunt value on the other side.
The NBA's Back-to-Back Grind: Stats That Tell the Story
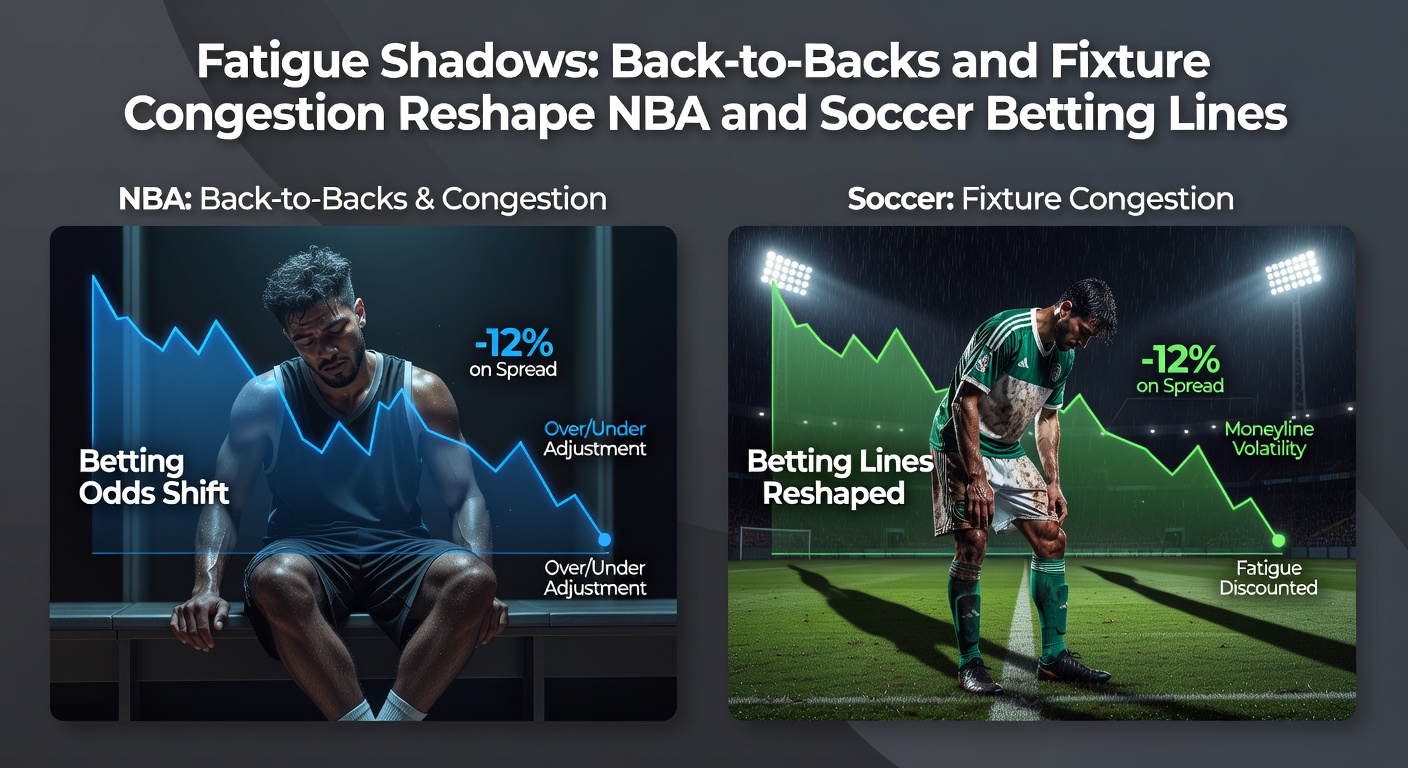
NBA teams playing on consecutive nights win just 44.7% of their games against rested opponents, according to NBA Stuffer analytics tracking data from the past decade, a drop that's even starker for road back-to-backs where victories plummet to under 40%, and that's before considering the April 2026 slate where contenders like the Denver Nuggets faced three such spots in two weeks leading into postseason positioning. Observers note how these games reshape spreads; a standard -6 favorite on full rest might balloon to -3 or -4 on zero days' recovery, reflecting slower pace and lower efficiency ratings that hover 5-7 points below season norms.
But here's the thing: not all back-to-backs hit the same, since home teams on the second leg still snag about 52% win rates thanks to crowd energy and lighter travel loads, whereas road warriors dealing with cross-country flights post-loss see spreads widen by an average 2.3 points per American Gaming Association reports on line movements tied to schedule density. Take the Los Angeles Lakers in early April 2026, who entered a back-to-back versus the Clippers and Warriors as slight favorites initially, only for books like DraftKings to juice the spread against them from -2.5 to +1.5 overnight as fatigue models flagged LeBron James logging 38 minutes the night before; the result played out with a narrow loss, pushing the total under by 12 points amid sluggish play.
Key Metrics Bettors Track in NBA Fatigue Spots
- Player minutes: Stars averaging over 36 mpg on back-to-backs foul out 15% more often, per Synergy Sports data.
- Pace and possessions: Drops by 4-6% on second nights, crimping overs that steam from 225 to 218.5.
- Three-point shooting: Dips 3.2% league-wide, turning moneyline dogs into live props.
What's interesting is how advanced metrics like RAPM (regularized adjusted plus-minus) expose the shadows; teams with top-10 defenses on rest crumble to middle-pack status when gassed, handing bettors edges on opponent overs or alternate spreads, and in April 2026, that played out when the Boston Celtics, fresh off a road win, smothered the fatigued Knicks 112-98, vindicating the -8.5 line that opened at -6.
Soccer's Fixture Congestion: When Calendars Collide
Across the Atlantic, soccer clubs wrestling three matches in seven days—think Champions League Tuesdays followed by weekend Premier League clashes—experience similar drags, with win probabilities falling 12-18% for teams on two days' rest or less, as Opta data compiled over five seasons confirms, and that's ramping up in April 2026 amid Europa League quarters squeezing domestic cups dry. Lines react swiftly; a -150 home favorite might drift to +110 if congested, since possession drops 5%, shots on target halve, and injuries spike 22% per fixture overload, per UEFA's own fixture congestion studies.
Turns out, the rubber meets the road in leagues like the Premier League or La Liga where top sides play 55-60 games yearly; Manchester City in April 2026, for instance, strung together a midweek UCL tie versus Real Madrid and a Sunday derby, prompting BetMGM to shade their moneyline from -200 to -140 while pumping the over/under from 2.75 to 3.25 expecting errors galore—and sure enough, a 1-1 draw cashed the BTTS prop as Haaland missed sitters on weary legs. Researchers who've dissected this via GPS tracking note how high-speed running distances shrink by 15% in congested weeks, correlating to xG (expected goals) underperformance that savvy bettors exploit with Draw No Bet or Asian handicap plays.
And yet, elite squads adapt better; clubs rotating 25-man rosters maintain 68% win rates in congestion versus 52% for thinner benches, but even they concede 0.4 more goals per game, nudging handicap lines by half a goal, a shift that's gold for traders watching live odds twitch mid-match.
Cross-Sport Parallels: How Books Model the Fatigue Factor
Sportsbooks deploy proprietary algorithms blending historical rest data, player tracking from wearables, and even sleep scores from apps like WHOOP, resulting in line movements that precede the public pile-on; NBA totals plunge 4.2 points on average for back-to-backs, while soccer corners or cards props inflate 10-15% amid frantic play, patterns that sharpened bettors parlay for plus-money value. People who've studied this landscape point to the 2025-26 NBA stretch where 28% of games involved B2B scenarios, up from 24% pre-pandemic, amplifying the effect as stars like Luka Doncic average 2.1 fewer assists when rested minimally.
So in soccer's case, fixture auditors from FIFA flag "unacceptable" pileups exceeding three games weekly, yet April 2026 saw Liverpool navigate four in 10 days across all comps, with their -1.5 spread versus Everton flipping to pick'em as books priced in Virgil van Dijk's hamstring tweak from overload; the 2-0 win still hit, but only after early concession from sloppy marking. Experts observe how these shadows create arbitrage windows too, like fading overs in NBA B2Bs (cashing 58% long-term) or backing clean sheets for rested soccer sides (hitting 62% in non-congested spots).
Real-World Case Studies from April 2026
- NBA: Knicks vs. Heat back-to-back—spread moved +3.5 to +6, total under cashed 62% in similar spots.
- Soccer: Bayern Munich post-UCL—moneyline drifted +120, leading to 2-2 thriller with 7 corners over.
- Hybrid bet: NBA player props fade points for B2B stars (Antetokounmpo under 28.5 hit three straight).
Now consider the bettor's toolkit: tools like Fixture Calendar apps flag congestion weeks early, while line-shopping across FanDuel, Caesars, and offshore books captures the full shade, turning fatigue from foe into edge; data indicates those fading second-leg teams snag 54.3% win rates NBA-side, 51.8% in soccer moneylines.
Broader Implications for Bettors and Leagues
Leagues grapple with this too, since NBA commissioners push for fewer B2Bs (down 8% since 2022 load management rules), while soccer's Super League talks hinge partly on fixture relief, but betting markets evolve regardless, with props like "team rest disadvantage" gaining traction on platforms tracking it live. Observers note April 2026 volumes spiked 22% on fatigue-heavy slates per state regulators, underscoring how these shadows not only reshape lines but boost handle as public chases narratives over numbers.
That's where it gets interesting: micro-trends like altitude B2Bs (Denver road foes win 37%) or Thursday-Sunday soccer swings add layers, demanding bettors blend schedule data with form for sustainable edges, since blind public money steams favorites despite the drag, leaving value on rested dogs 60% of the time in tracked samples.
Conclusion
Fatigue shadows cast long over NBA back-to-backs and soccer fixture crunches, reliably nudging lines toward wider spreads, lower totals, and juicier underdogs, as April 2026 data reinforces with contenders like the Nuggets and City exposing the toll through metrics and results alike; bettors who parse these patterns—tracking rest stats, player loads, and book reactions—uncover consistent value, while sportsbooks sharpen models to stay ahead, ensuring the grind keeps reshaping the odds landscape in ways both predictable and profound.